Betfair chart / Betfair graph of the day

A great thread gone quiet... time to resurrect it!
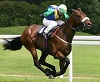
Setting the scene, a solid days trading: bank up 10% after a couple of hours. I just witnessed one of the biggest steamers of the day - forecasted SP 34/1 backed in to 3.4 favourite.
But this doctor was not good for ones blood pressure...
After a solid green in the pre-off my newbie lack of discipline got greedy, I figured it would go out a little as bookies tried to balance books early in play but come in steadily from there as the race progresses so put a few backs in at 5.
Of course, my backs were taken swiftly but then for reasons unknown it proceeded to drift to 10. Ok, it was in midfield, and the leaders were going a healthy pace but he didn't look to be jumping badly or going terribly...
Anyway, as the race progressed past halfway, I held my position hoping such a strong money signal would yield a return... of course, then the horse really did seem to start treading water as the jockey went to work and the good Doctor Ric drifted out past the 100 mark...
I'd over-staked. I felt frustrated. I lost my concentration. The next thing I notice is a flicker of green on my screen... he's somehow come back and I can grab my money back... I click the greenup ladder, just wanting to escape without the loss I'd assumed a few seconds earlier... *thinking* mmmm my app is a bit sluggish to respond, did I click? mmmm... nothing's happened... *$*# this new API!!! So I click greenup again in my panic... now of course the good Doctor Ric is leaving the rest of the field behind... so now my total loss has increased another 50%...
A nice little earner turned into a chunk of bank missing... damn... time for a walk...
Moral of the story.
Don't get greedy inplay.
Keep your focus and stay calm, no matter how bad the situation appears.
Have your exit strategy ready.
The more I trade the more I think success in this game is like success in my all time favourite sport of golf... birdies are all well and good but the secret is avoiding the disasters. Damage avoidance is the key.
You do not have the required permissions to view the files attached to this post.
The day of the 'mptons' 
Found it tough to read the markets today. My concentration wasn't there.
No individual market stood out so I thought I'd post the 'shape' of the markets today by price and volume.
Found it tough to read the markets today. My concentration wasn't there.
No individual market stood out so I thought I'd post the 'shape' of the markets today by price and volume.
You do not have the required permissions to view the files attached to this post.
Thanks for the positive feedback Euler, I'm quite sure they are nothing compared to your own market dashboards but they do allow a newbie like me to visualize the 'shape' of the market.
Wolverhampton 5:40pm
Bonfire Heart just kept drifting... Guess who was on the wrong side? :/
Fortunately, I got out fairly early and watched in awe waiting for the rebound which never happened...
Wolverhampton 5:40pm
Bonfire Heart just kept drifting... Guess who was on the wrong side? :/
Fortunately, I got out fairly early and watched in awe waiting for the rebound which never happened...
You do not have the required permissions to view the files attached to this post.
Today's visualization of the markets for your viewing pleasure... was a bit late back due to personal commitments so missed the first few races.
Wolverhampton was super volatile today, many big steamers and drifters. Fakenham and Musselburgh were calmer waters.
Anyone know why the 7:40pm at Wolverhampton was delayed so long?
Wolverhampton was super volatile today, many big steamers and drifters. Fakenham and Musselburgh were calmer waters.
Anyone know why the 7:40pm at Wolverhampton was delayed so long?
You do not have the required permissions to view the files attached to this post.
Compare and contrast:
Hexham in the afternoon v Wolverhampton AW in the evening
Kinda like a peaceful walk in the country versus a crazy night on the town
I've put the volume and price together so one can understand more clearly how they interact. And made the colours match up for H1 to H4.
All feedback appreciated - especially negative!
You do not have the required permissions to view the files attached to this post.